There are a lot of questions on the minds of buyers with what is going on in the GTA Housing Market. It is without question that the recent changes implemented to cool the real estate market by the government, coupled with the rising Bank of Canada interest have had an impact on the amount of homes selling.
There are still a lot of active buyers looking for a home to purchase and we’ve shifted from “how many offers are we competing against?” to “Is my investment going to be secure?”. Nobody wants to get into a situation where they are purchasing a home that will be losing value and this brief snapshot of what is going on into the GTA housing market will give you some insight into what is going on in each of the big markets and what the trends are.
GTA Housing Market Report: Peel Region
Brampton
Brampton is a city that has been hit rather hard from the GTA Housing Market shift. Brampton is located in Peel Region, with a population slightly above 600,000 people. The draw for people moving to Brampton while the market was at it’s peak, was that buyers could get a lot of square footage in a newer home, while being a short commute to Toronto, Mississauga and having a close proximity to HWY 401.
Brampton has held a steady level of inventory for the past five months. Shockingly, the average price of a listed home has gone up since February and that is likely due to sellers rushing for the summer market and still holding on to the belief that their house is worth more than the market can bear.
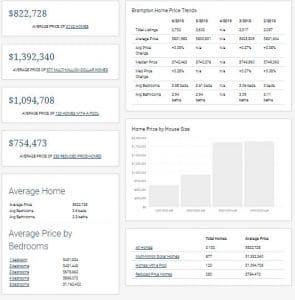
The Average price of a listing in Brampton is $742,463 and having an average of 3.58 Bedrooms and 2.94 Bathrooms in the home. The average price of properties which have had a price reduction is $754,473. The chart below shows you a detailed breakdown of pricing for the Brampton real estate market.
Mississauga
Mississauga has experienced a downturn since the shift in the GTA Housing Market. Mississauga is one of the 10 largest cities in Canada and experienced much of it’s growth due to it’s close proximity and easy accessibility to Toronto. While Mississauga still has several pocket communities that remain desirable and expensive, some of the smaller communities have been experiencing a bigger drop in pricing. Detached homes have been hit the hardest, particularly in the $800,000-$1,200,000 price point.
The inventory of homes remains high in Mississauga. The average price of a home has come down progressively month over month as sellers have been adapting to the changes in the market.
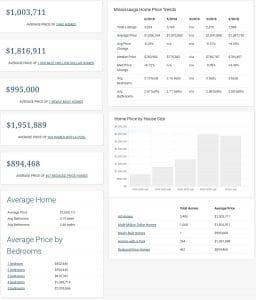
The average price of a listing in Mississauga is $1,006,169 and has an average of 3.19 Bedrooms and 2.67 Bathrooms. The average price of properties which have had a price reduction is $894,468. The chart below shows you a detailed breakdown of pricing for the Mississauga real estate market.
GTA Housing Market Report: Halton Region
Milton
Milton is a fast growing pocket community just north of Oakville in Halton. The biggest draw to Milton in the early 2000’s up until now has been the amazing affordability of new build homes. The pricing definitely caught up with where the market was by 2013 but Milton still has a lot of new builds coming on the market shortly. With pricing that is still providing value and it’s close proximity to HWY 401, Milton is still a desirable area for young families wanting more bang for their buck.
The shift in the GTA housing market has impacted the Milton market. While homes listed under $650,000 (particularly semi-detached and townhouses) are still doing quite well overall, the larger detached homes are sitting for considerably longer. One of the issues that Milton faces is that because a lot of the homes are newer, there is a lot of similarity in the design of homes in each square footage range and unless a seller is priced aggressively, their home can sit longer because it doesn’t stand out.
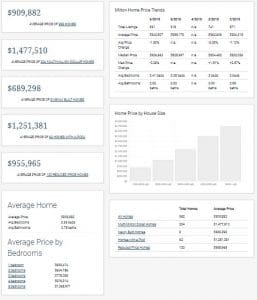
The average price of listings in Milton has dropped over the past several months and a lot of that can be attributed to sellers who have relisted their homes at a lower price than they initially entered the market with. The average price of a listing is $909,882 having an average of 3.41 bedrooms and 2.83 bathrooms.
The average price of a property that has had a price reduction is $955.965. The chart below gives you a detailed breakdown of pricing for the Milton real estate market.
Oakville
Oakville has always been seen as an exclusive pocket just west of Mississauga. One of the biggest draws to Oakville is the exceptionally highly ranked schools in the district, with many of them in the top 10% of schools in Ontario. They also enjoy the highest household income for any city in Canada.
The changes in the GTA housing market have hit Oakville surprisingly hard. While the exclusive higher end homes still have their niche buyers, many of the homes in newer developments have been lingering. The changes in the mortgage rules and lending criteria of many banks (particularly the mortgage stress test for owners with 20% down) mean fewer would be buyers can even afford the homes.
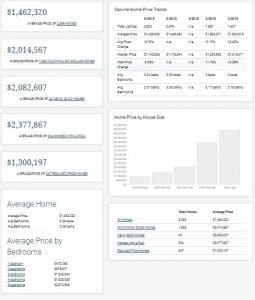
The average price of a listing in Oakville is $1,428,923 with an average of 3.34 bedrooms and 3.01 bathrooms. While the average price has progressively come down over the past several months, this number can often be skewed when there is an influx of $3,000,000+ homes coming on the market in a particular month.
The average price of a property that has had a price reduction is $1,300,197. The chart below gives you a detailed breakdown of pricing for the Oakville real estate market.
Burlington
Burlington is in the west end of Halton and is very much a desirable community. It had an aggressive run up in pricing leading up the the height of prices in the GTA housing market as many would be buyers getting pushed out of Mississauga or Oakville made the jump over to Burlington while the pricing was still reasonable. They were one of the leading markets for price gain in the final 6 months leading up to peak real estate prices.
The shift in the GTA housing market hasn’t hit Burlington as hard as many of the other communities. This can be because Burlington does have a lot of attached row townhouses and condo townhouses with low maintenance fees under $700,000. The larger detached homes in the $800,000-$1,400,000 range have experienced a slowdown and buyers are focusing more carefully on specific districts.
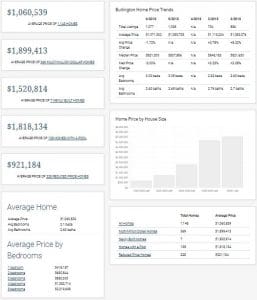
The average price of a detached home in Burlington is $821,200 and hasn’t fluctuated from the average price in February of 2018. The homes have an average of 3.09 bedrooms and 2.62 bathrooms.
The average price of a property that has had a price reduction is $921,184, showing that many of the homes with a price reduction are in the $1,000,000+ range. The chart below gives you a detailed breakdown of pricing for the Burlington real estate market.
GTA Housing Market Report: Hamilton
Hamiltonians would not take a liking to be bulked into “the GTA” but the truth is Hamilton experienced a huge boost from the affordability they provided and many of the buyers in Hamilton were from areas like Mississauga and Toronto.
Hamilton is definitely a city that has it’s own character and entrepreneurial flair. With many independent stores, a thriving food and art scene as well as a slew of young start-up companies, Hamilton appeals to many younger buyers who don’t want a “suburban” lifestyle.
Hamilton has seen a big shift as a result of what is happening in the GTA housing market. Given that most buyers are from the GTA, the trickle down affect of getting less money from the sale of their homes, means they have less equity to purchase a home in Hamilton. While Hamilton is seen as a great place for many artistic and city seeking would be home buyers, they do not enjoy a vibrant economy and local buyers don’t have the deep pockets that some of the out of towners who inflated the pricing in the market peak did.
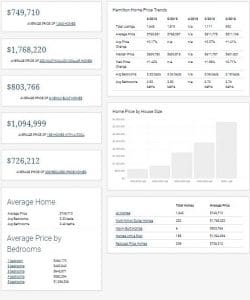
That being said, Hamilton is still overall a great area and one which I believe will continue to be sought after for home buyers. The average price for a home is $769,351 and has an average of 3.32 bedrooms and 2.52 bathrooms.
The average price of a home that has had a price reduction is $726,212. The chart below gives you a detailed breakdown of pricing for the Hamilton real estate market.
GTA Housing Market Report: Toronto
At the heart of the GTA housing market is Toronto. Toronto is the largest city in Canada and the 3rd largest in North America (behind New York and LA). Toronto is at the center of the rise in the GTA housing market and also at the shift in the GTA housing market. What goes on in Toronto, impacts every surrounding city and suburb.
Toronto has definitely been impacted by the shift BUT has many more pockets that continue to hold their value and have some which have even shown growth. The reason for this is Toronto has always been seen as the most desirable place to live for those working downtown and in close proximity to it. Many of the wealthiest professionals in GTA call Toronto home and the fact is, a change to mortgage rules will not impact certain demographics as much as others.
What has happened though, is there are many “move up” buyers who enjoyed taking the large gains from their homes to purchase something bigger or in a better pocket of the city. These buyers had strong purchasing power through the equity of their existing home but the changes in mortgage rules, particularly the stress test for those buying with 20% had a big impact. Those buyers were equity rich, but on paper, their incomes did not nearly grow as rapidly as the value of their houses and the result is that their purchasing power got slashed drastically.
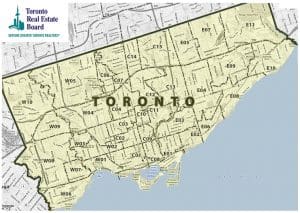
Because of the huge diversity of pricing within what is considered “Toronto” on the real estate board, the pricing has to be broken down by district. We have included a chart that shows each district below and if you would like the exact data for your district or one you are interested in, please reach our and we will provide it to you directly. This will prevent you having to sift through 20+ images to get your exact community. If you would prefer, you can create an account on our online home search tool and get the data right away and also create and customize a home search based on your specific preferences.
GTA Housing Market Report: Summary and Notes
So, what do the prices in the GTA housing market mean to you? The data is great but the factors that are particular to you and your family will determine where you should buy and more importantly, whether or not it makes sense for you to buy in this market.
There are some great opportunities for move up buyers, buyers who are currently living in condos and are looking to upsize as well as buyers who are looking to shift from some suburbs and move closer to the city core.
As we like to be accurate with the data presented, we highly recommend reaching out to us for specific, up to date and the most accurate data we can provide. The charts listed above are a great general framework for what is going on in the GTA housing market but the search data unfortunately can also include commercial properties and land for sale, which can greatly vary the pricing.
It also includes relisted homes into their numbers, so a home that was listed for $1,000,000 on June 1st and relisted for $980,000 on June 15th and then relisted again on June 29th for $950,000 will show up as 3 listings in a single month and that factors in to the overall average pricing and can skew the numbers.
We want to be forthcoming and honest, so once again, please reach out to us directly if you would like to get the most accurate pricing for specific houses in a community you are interested in or considering a purchase in.


